What to Watch for in Golf Car-Type Vehicles in 2022: On-Going Demographic and Technological Changes Will Drive a New Market
Golf car-type vehicles are very likely to play a growing role in urban and suburban mobility environments in the coming year. In this article the forces shaping the market are analyzed from two perspectives: That of the consumer and through the prism of vehicle upgrades and newly available technology.
The consumer’s perspective: Changing demographics and preferences
Americans are moving their residences in increasing numbers, and the salient features of this movement have implications for the small, electric vehicle market—specifically the market for personal transportation mobility, i.e., PTVs. These features are: a) Net out-migration from urban centers; and b) the movement from Northeaster and Midwest States to Southern States.
The net movement to suburbs and beyond: The trend to more friendly PTV environments
A study conducted by the Federal Reserve Bank of Cleveland documents a major shift in population demographics, namely, the movement out of major urban centers to the suburbs and even beyond suburbs contiguous to urban centers.
Figure 1–Estimated Net Monthly Out-Migration from Urban Centers (000s)
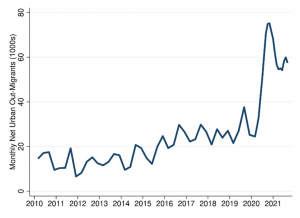
The graph to the left shows the net monthly out-migrations from urban centers across the country. You can observe the steady, albeit moderate trend upward in net out-migrations in the 2010 to 2019 time period. When COVID strikes, net out-migration jumps from about 20,000 to 80,000 on a monthly basis.
Subsequently, in 2021, the rate of net out-migration drops, but is still well above the moderate trend in prior periods.
It should be noted that these are net figures, meaning the difference between out-migration and in-migration. In other words the gross out-migration is quite a bit higher than in-migration, but people are still deciding to move into urban centers. (The demographics of those moving out and those moving into urban centers would be another interesting aspect of this demographic trend, but would be the subject of additional analysis.)
The following graph, also from the Cleveland Fed, traces the gross figures for migration in and out of urban centers.
Figure 2—Estimated Gross Migration into and from Urban Centers
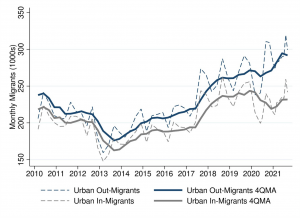
As may be seen in Figure 2, both gross out-migration and in-migration declined from 2010 to 2014, indicating relative stability in overall urban center populations. From 2014 on, however, both trends were on the rise. In 2020 and 2021 the gap between the two sets of data increased—this trend being profiled in the previous graph. Note that the monthly average out-migration reached the 300,000 level. Were that monthly average to continue, it would mean, on an annual basis, about 3.6 million Americans would be leaving urban centers!
Urban exodus trend substantially precedes the COVID crisis
Another important point to be drawn from the data in Figure 2 is that the urban exodus started in 2013, well before the COVID crisis of early 2020. It does appear that the COVID crisis added to the exodus in 2020 and certainly contributed to the downturn in urban in-migration.
Where are people moving?
North American Moving Services, Inc. (the moving company) recently published its own data on the subject of what States people are moving from, and what States they are moving to. In summary:
- The top 5 exodus States are New York, New Jersey, Illinois, Maryland, and California;
- The top 5 States where people are headed are Texas, Idaho, South Carolina, North Carolina, and Tennessee. Other popular inbound States are Florida and Arizona.
- In general there is a movement out of States with heavy urban concentrations to less densely populated States, in particular, States that comprise the Sun Belt.
Implications for the PTV market
As a general proposition, the move to suburban environments from urban centers bodes well for the market for PTVs. Suburban environments with less public road traffic offer a significantly better setting for small, golf car-type vehicle adoption—in particular, the use of PTVs as a personal mobility as a feasible option to the increasingly more expensive to operation conventional automobile.
The fact that most of the State-to-State movement is toward the warmer climates of the Sun Belt, is an obvious plus factor. The open driver/passenger enclosures that still typify PTVs are far more welcome and practical in warmer climates.
The geographic movement out of cities has been facilitated by the virtual workplace, which, in turn has resulted in a new lifestyle for many. This new and emerging mode of living can be described as a dispersed living lifestyle, which eliminates the need for much of commuting, and thus opens the door for broader mobility options.
Consumer tastes and preferences in mobility are changing
While operating environments are a real nudge factor in supporting market gains for PTVs, what evidence do we have that consumer tastes and preferences are changing with regard to mobility options? One can infer that important changes in the usage of golf car-type vehicles in that, in the categories of PTVs and LSVs, States and municipalities across the country are formulating regulations concerning the use of such vehicles on public roads and streets. This activity would not be happening were golf car-type vehicles simply confined to golf courses and gated communities.
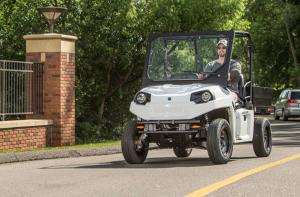
Most States have set out guidelines for use on public roads but left the specifics up to local governments.
It has become increasingly clear that PTVs, usually licensed as LSVs, when used on public roads, have become a viable alternative to conventional automobiles in short distance travel; e.g., to and from the supermarket, pharmacy, convenience store, etc., and this has spurred local transportation officials to action. While almost all local councils have regulated against use of PTVs on highways and roads where the speed limit is above 35 miles per hour, many of the local ordinances meticulously specify where PTVs can cross major highways or busy streets, as they move from neighborhood to neighborhood.
Safety becomes an ever more pressing issue
Given the increased popularity of PTVs as an option to conventional vehicles, driver and passenger safety, as well as pedestrian safety, becomes an ever more pressing issue. While most current model PTVs has been upgraded with an array of passive safety features, no manufacturers, as yet, has incorporated active safety components in their vehicles. Passive features include:
- Seat belts;
- Automotive grade windshields;
- Light kits, including LED lighting, brake lights, and turn signals;
- Back-up cameras.
Active safety features, which would upgrade the PTV to a Level 2 autonomy, would include:
- Collision alert;
- Automatic braking;
- Lane change warning; and
- Geofencing
The last feature, geofencing, would enhance transportation officials’ ability to regulate traffic, specifically keep PTVs off high-speed roads. (Geofencing is a currently available attribute in golf course fleet control systems.)
The addition of active safety features is, at this point, the key to market acceptance by all stakeholders—in particular, consumers, manufacturers, and local transportation officials.
How quickly will the urban/suburban mobility market develop for PTVs?
With the demographic foundation for the USM market growing rapidly, and consumer preferences also growing for a small electric vehicle as a desirable option to the conventional, on-road vehicle, just how likely is it that—and how long, will it take for—PTV-type vehicles to become a mass market? With active, Level 2 autonomous features, the likelihood is almost 100%. The market research arm of Small Vehicle Resource, LLC, of which the author is a Managing Director, projects an increase in the market, reaching market levels of 300,000 or more by 2027.
Realizing this market opportunity will take strategic vision at the corporate level. To some degree, perhaps a significant degree, manufacturers will have to “make the market” Henry Ford once said, “If I had asked people what they wanted, they would have said faster horses.” It can certainly be said that he delivered what they wanted.
Contact the Author: Steve Metzger at smetzger@smallvehicleresource.com. Or check out our website at www.smallvehicleresource.com, where you will find an extensive database of vehicle models and can make side-by-side comparisons of vehicles based on a full set of specifications.

